Fibrosis
An investigation conducted by Nøjgaard et al. (2003) involved 127
patients with liver disease.

An important part of the diagnostic procedure for these patients was
to quantify the degree of liver fibrosis, by performing a liver
biopsy. Since this is an invasive and time-demanding procedure with
potentially serious side effects, it would be advantageous to replace
such a biopsy with something simpler, preferably some markers that may
be quantified from blood samples.

The main purpose of the study was to see whether one or more of three
specific blood tests could predict the degree of liver fibrosis.


Variable list:

id: patient identification (useful for technical reasons)

stage: Degree of fibrosis, as determined by the biopsy
        0: No
        1: Slight
        2: Modest
        3: Severe

Blood tests:

ykl40:	Value of the blood test ``human cartilage glycoprotein 39''

p3np: 	Value of the blood test ``type III procollagen peptide''

ha: 	Value of the blood test ``hyaluronan''
The dataset
Scripts for loading the dataset
Programs related to Fibrosis
| Table 1.5.3: R-source SAS-source (tab-fibrosis-ch1-pres) | 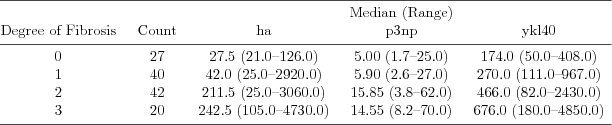 |
| Figure 7.1.1: R-source SAS-source (fig-ch7-fibrosis-pres) | 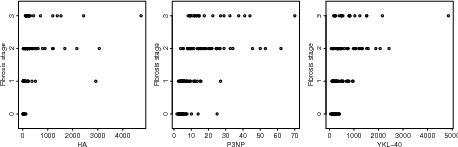 |
| Table 7.1.1: R-source SAS-source (tab-ch7-fibrosis-pres) | 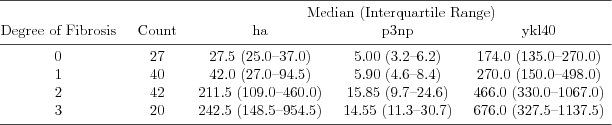 |
| Table 7.1.2: R-source SAS-source (tab-ch7-fibrosis-gamma2) | 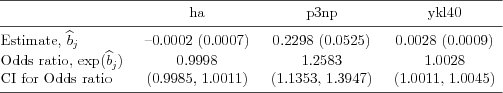 |
| Figure 7.1.2: R-source SAS-source (fig-ch7-fibrosis-pres-log) | 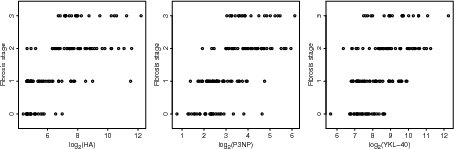 |
| Table 7.1.3: R-source SAS-source (tab-ch7-fibrosis-gamma2-log) | 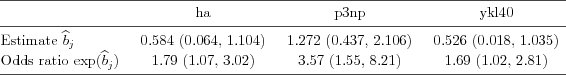 |
| Table 7.1.4: R-source SAS-source (tab-ch7-fibrosis-separate-logistic) | 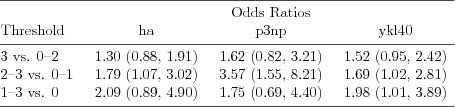 |
| Figure 7.1.3: R-source SAS-source (fig-ch7-fibrosis-separate-lr) | 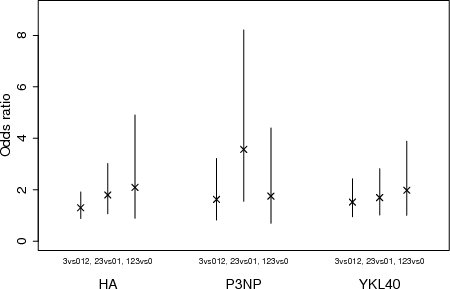 |
| Table 7.1.5: R-source SAS-source (tab-ch7-fibrosis-prop-odds-results) |  |
| Figure 7.1.4: R-source SAS-source (fig-ch7-fibrosis-resplots-ha) | 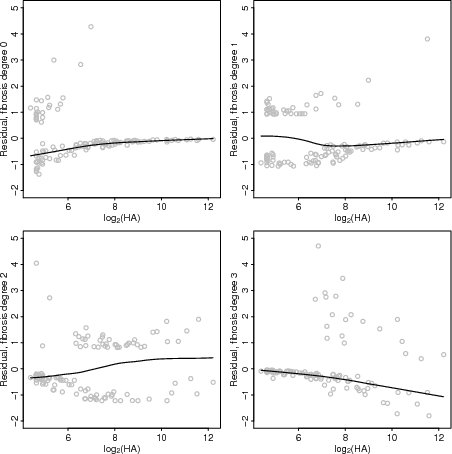 |
| Figure 7.1.5: R-source SAS-source (fig-ch7-fibrosis-resplots-p3np) | 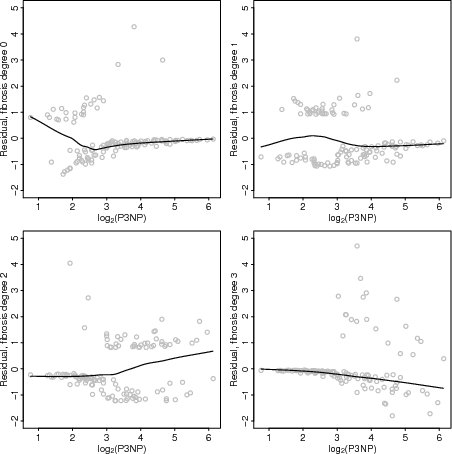 |
| Figure 7.1.6: R-source SAS-source (fig-ch7-fibrosis-resplots-ykl40) | 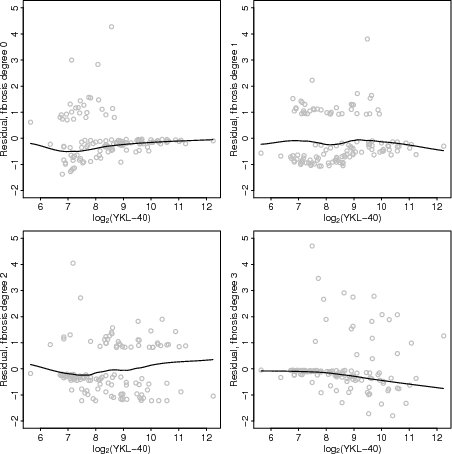 |
| Figure 7.1.7: R-source SAS-source (fig-ch7-fibrosis-resplots-cum) | 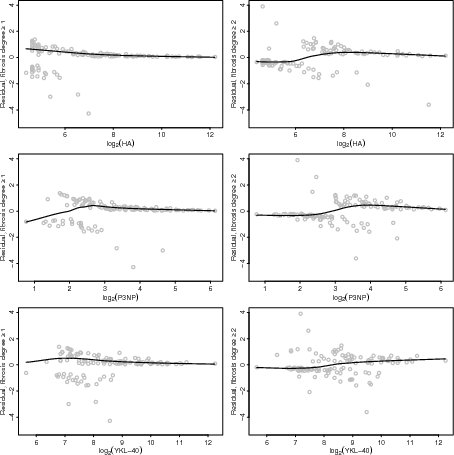 |
| Table 7.1.6: R-source SAS-source (tab-ch7-fibrosis-estimates-non-prop) | 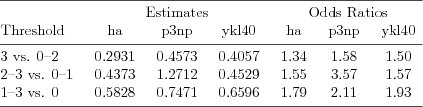 |
| Figure 7.1.8: R-source SAS-source (fig-ch7-fibrosis-est-prob2) |  |
| Table 7.1.8: R-source SAS-source (tab-ch7fib-linearmodel) | 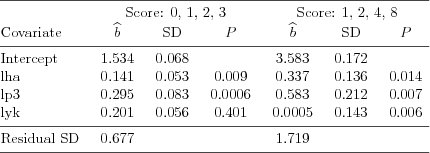 |
| Figure 7.1.9: R-source SAS-source (fig-ch7fibmean) |  |
| Figure 7.1.10: R-source SAS-source (fig-ch7fibmean-res) | 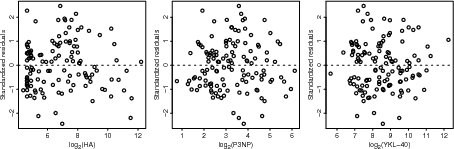 |
| Table 7.1.9: R-source SAS-source (tab-fib-polychot-simple) | 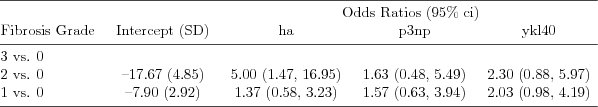 |
| Table 7.1.10: R-source SAS-source (tab-fib-polychot) | 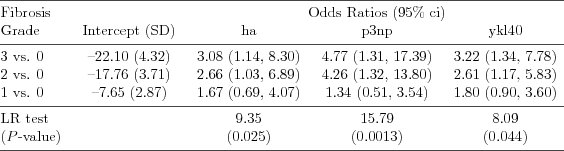 |
