Fever in Pregnancy
Fever in early pregnancy and risk of fetal death

A sub-study of The Danish National Birth Cohort Study.
The Danish National Birth Cohort Study was a nationwide study of
pregnant women and their offspring (Olsen et al., 2001).
Between 1997 and 2002 more than 100,000 women were recruited to
the study at their first antenatal visit to the general practitioner.
When an informed consent form was received
by the study secretariat the women were invited to complete a
computerassisted telephone interview, scheduled to take place in
pregnancy weeks 12-16 (though, for a number of women, the interview
took place later). The interview provided information on a number of
``exposures'' suspected to be related to subsequent health outcomes
in the child. Andersen et al. (2002) analyzed a sub-sample of the
cohort consisting of women recruited before 31 March 1999
with the aim of studying the relation between fever in early pregnancy and
fetal death. We will here present data on women interviewed before pregnancy
week 17, who were still pregnant at week 17, and for whom information on
episodes of fever in pregnancy was obtained. These women were then followed
from week 17, the response variable of interest being fetal death.

Variable list:

gwint - gestational weeks at interview
episodes - number of fever episodes in pregnancy (before interview)
death - fetal death (yes=1, no=0)
mage - mother's age at interview
numabort - number of previous abortions
parity - previous live births: 0=no, 1=yes
gwbirth - gestational weeks at birth
smoke - 1=0 cigarettes/day, 2=1-10 cigarettes/day, 3=11+ cigarettes/day
        during pregnancy
alco - number of drinks per week during pregnancy
coffee - 1=0 cups/day, 2=1-7 cups/day, 3=8+ cups/day during pregnancy
length - birth length in cm
weight - birth weight in grams
The dataset
Scripts for loading the dataset
Programs related to Fever in Pregnancy
| Table 1.1.2: R-source SAS-source Stata-source (tab-feber-ch1intro-episodes) | 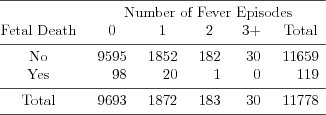 |
| Table 1.3.1: R-source SAS-source Stata-source (tab-feber-ch1link-alcohol) | 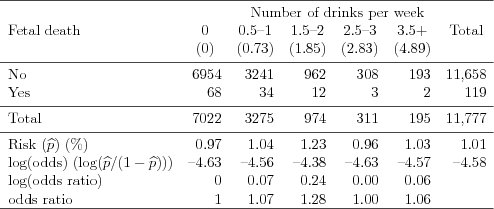 |
| Figure 1.3.4: R-source SAS-source Stata-source (fig-feber-ch1link-logoddsvsalco) |  |
| Table 2.2.1: R-source SAS-source Stata-source (tab-ch2fetal_loss) | 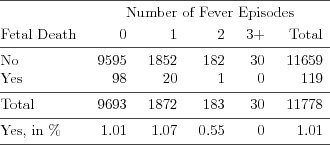 |
| Figure 2.2.1: R-source SAS-source Stata-source (fig-ch2-fetal-alcohol) | 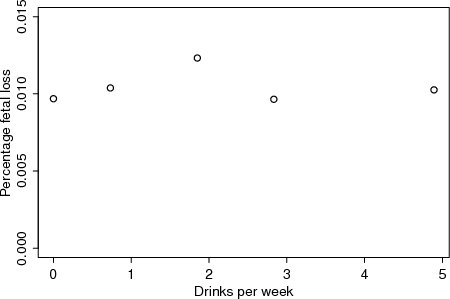 |
| Table 2.3.1: R-source SAS-source (tab-ch2-fever-episodes) | 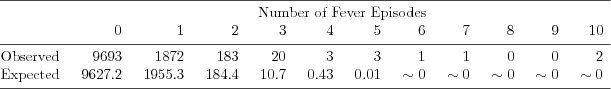 |
| Table 2.3.2: R-source SAS-source (tab-feber-ch2-check) | 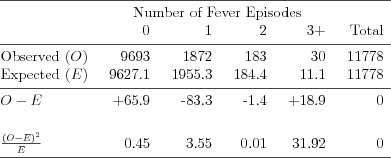 |
| Table 3.1.14: R-source SAS-source (tab-feber-ch3-pres) | 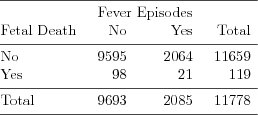 |
| Table 3.1.15: R-source SAS-source (tab-feber-ch3-ci) | 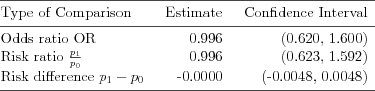 |
| Figure 4.1.12: R-source SAS-source Stata-source (fig-feber-ch4quantcovbinout-alcoscatter) | 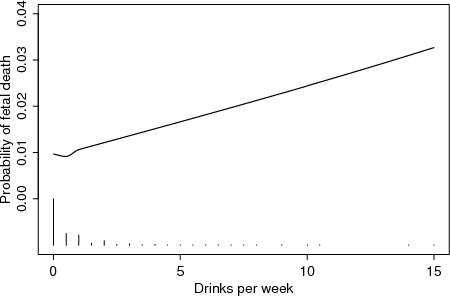 |
| Figure 4.1.13: R-source SAS-source (fig-feber-ch4quantcovbinout-alcologoddssmoother) | 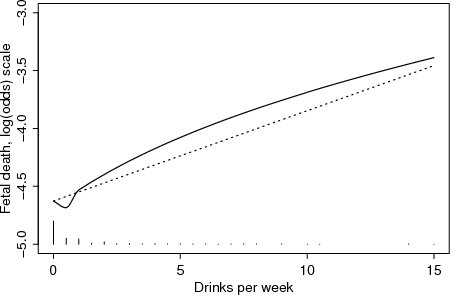 |
| Table 4.1.2: R-source SAS-source Stata-source (tab-ch4-alcotab) | 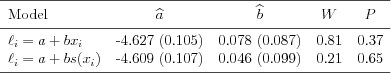 |
| Figure 4.1.14: R-source SAS-source (fig-feber-ch4quantcovbinout-residuals) | 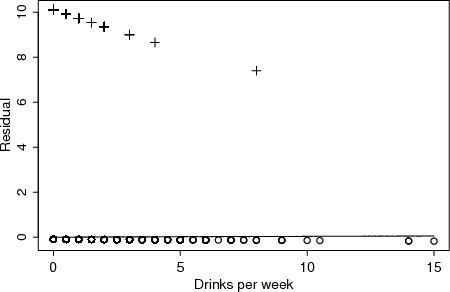 |
| Figure 4.1.15: R-source SAS-source (fig-feber-ch4quantcovbinout-alcologodds-devb) | 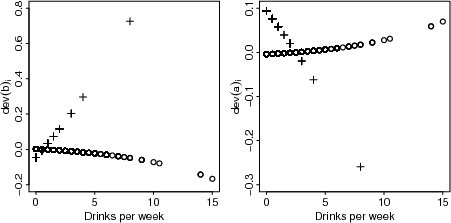 |
| Table 5.1.7: R-source SAS-source Stata-source (tab-ch5-feber-mh) | 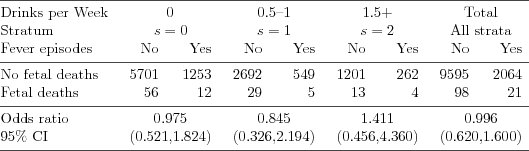 |
| Table 7.2.1: R-source SAS-source (tab-ch7-fever-episodes) | 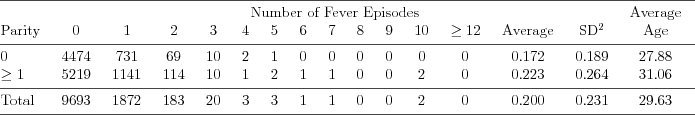 |
| Table 7.2.2: R-source SAS-source (tab-ch7-fever-estimates) | 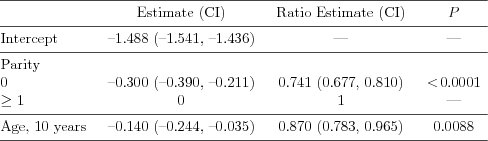 |
| Figure 7.2.1: R-source SAS-source (fig-ch7-poisson-fever-age) | 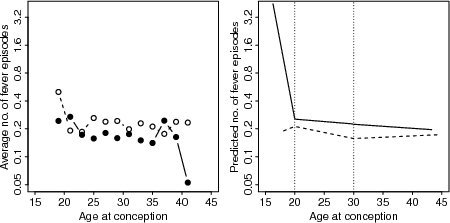 |
| Figure 7.2.2: R-source SAS-source (fig-ch7-poisson-residuals) |  |
| Table 7.2.3: R-source SAS-source (tab-ch7-poisson-gof1) |  |
| Table 7.2.4: R-source SAS-source (tab-ch7-poisson-gof2) | 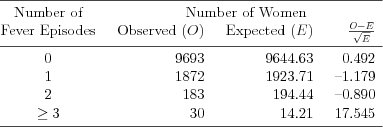 |
| Table 7.2.5: R-source SAS-source (tab-ch7-fever-comparison-estimates) | 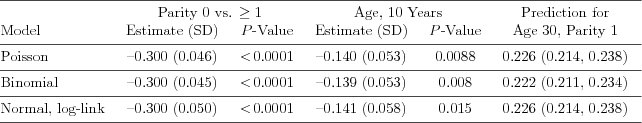 |
| Table 7.4.1: R-source SAS-source Stata-source (tab-ch7-fever-death) | 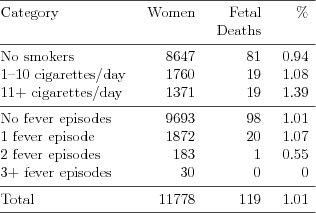 |
| Table 7.4.2: R-source SAS-source Stata-source (tab-ch7-death-res) | 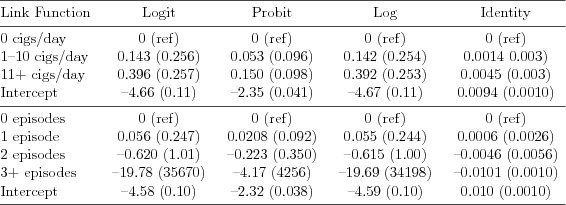 |
| Table 7.4.3: R-source SAS-source Stata-source (tab-ch7bin-age) | 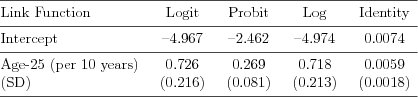 |
| Table 7.4.4: R-source SAS-source Stata-source (tab-ch7bin-sga) |  |
| Table 7.4.5: R-source SAS-source Stata-source (tab-ch7bin-sgareg) | 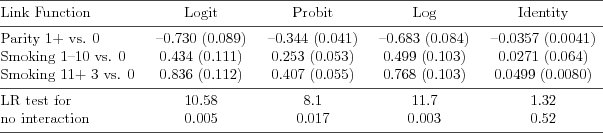 |
| Table 7.4.7: R-source SAS-source Stata-source (tab-ch7bin-sga-casecon) | 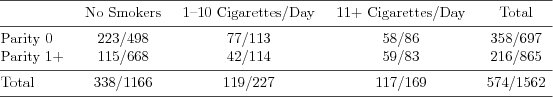 |
| Table 7.4.8: R-source SAS-source Stata-source (tab-ch7casecon-results) |  |
