Pbc 3
PBC3 was a multi-centre randomized clinical trial conducted in six
European hospitals. Between 1 Jan. 1983 and 1 Jan. 1987, 349 patients
with the liver disease primary biliary cirrhosis (PBC) were randomized
to either treatment with Cyclosporin A (CyA, 176 patients) or placebo (173
patients). The purpose of the trial was to study the effect of
treatment on the survival time. However, during the course of the
trial an increased use of liver transplantation
for patients with this disease made the investigators
redefine the main response variable to be time to ``failure of medical
treatment'' defined as either death or liver transplantation.
Patients were then followed from randomization until treatment
failure, drop-out or 1 Jan, 1989; 61 patients died (CyA: 30, placebo:
31), another 29 were transplanted (CyA: 14, placebo: 15) and 4 patients
were lost to follow-up before 1 Jan. 1989.
At entry a number of clinical, biochemical and histological
variables, including serum bilirubin, serum albumin, sex, age were
recorded.

List of variables:

ptno                  patient identification
unit                  hospital (1: Hvidovre, 2: London,  3: Copenhagen,
                                4: Barcelona, 5: Munich, 6: Lyon)
tment                 treatment (0: placebo, 1: CyA)
sex                   (1: males, 0: females)
age                   years
stage                 histological stage (1, 2, 3, 4)
gibleed               previous gastrointestinal bleeding (1: yes, 0: no)
crea                  creatinine (micromoles/L)
alb                   albumin (g/L)
bili                  bilirubin (micromoles/L)
alkph                 alkaline phosphatase (IU/L)
asptr                 aspartate transaminase (IU/L)
weight                body weight (kg)
days                  observation time (days)
status                status at exit (0: censored, 1: liver
                                      transplantation, 2 : dead)
The dataset
Scripts for loading the dataset
Programs related to Pbc 3
| Figure 1.1.1: R-source SAS-source Stata-source (fig-pbc3-ch1intro-KMtreat) |  |
| Table 1.3.2: R-source SAS-source Stata-source (tab-pbc3-ch1link-bili) |  |
| Figure 1.3.6: R-source SAS-source Stata-source (fig-pbc3-ch1link-KMbili) |  |
| Figure 1.3.7: R-source SAS-source Stata-source (fig-pbc3-ch1link-hazratbili) |  |
| Table 3.1.16: R-source SAS-source (tab-pbc3-means) |  |
| Table 3.1.17: R-source SAS-source (tab-pbc3-percentages) | 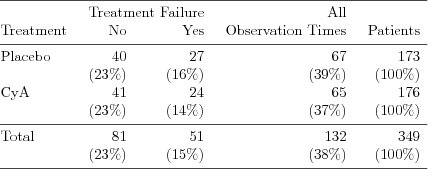 |
| Figure 3.1.6: R-source SAS-source (fig-pbc3-ch3surv2sample-KMtreat) | 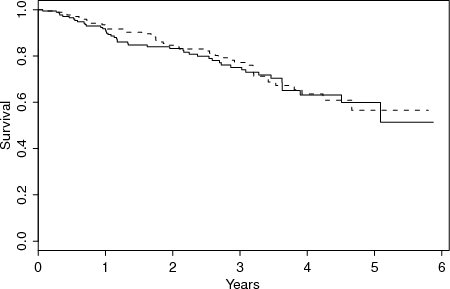 |
| Figure 3.1.7: R-source SAS-source (fig-pbc3-ch3surv2sample-modelcheck) | 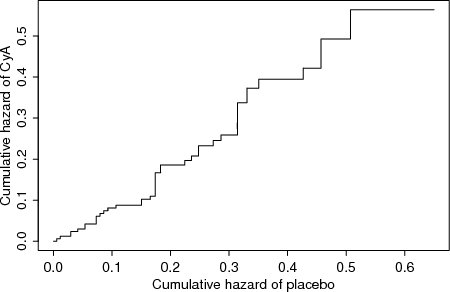 |
| Figure 3.1.8: R-source SAS-source (fig-pbc3-ch3surv2sample-pseudo) |  |
| Table 3.1.18: R-source (tab-ch3logrank-2) |  |
| Table 3.1.19: R-source SAS-source (tab-pbc3-ch3-treat) |  |
| Figure 3.2.6: R-source SAS-source (fig-pbc3-ch3-KMbili) |  |
| Figure 3.2.7: R-source SAS-source (fig-pbc3-ch3survksample-modelcheck) | 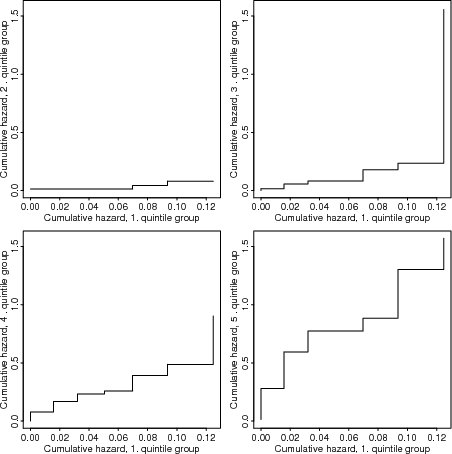 |
| Figure 3.2.8: R-source SAS-source (fig-pbc3-ch3survksample-pseudo) | 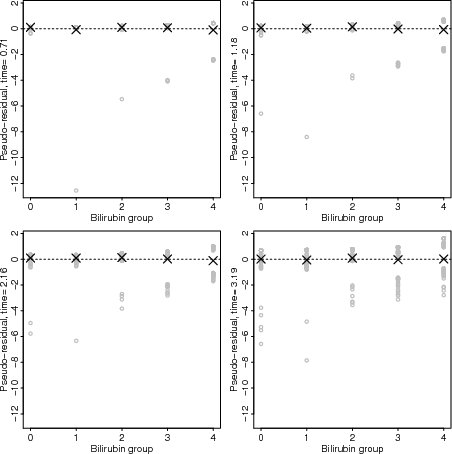 |
| Table 3.2.14: R-source SAS-source (tab-pbc3-ch3-ksamplebili) | 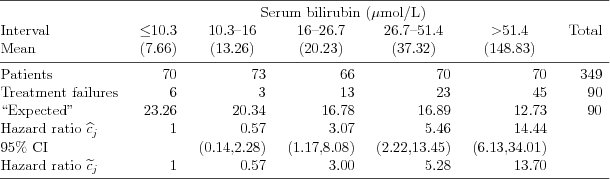 |
| Table 4.1.3: R-source SAS-source (tab-ch4-bilitab) |  |
| Figure 4.1.17: R-source SAS-source (fig-pbc-ch4-pseudobiliscatter) | 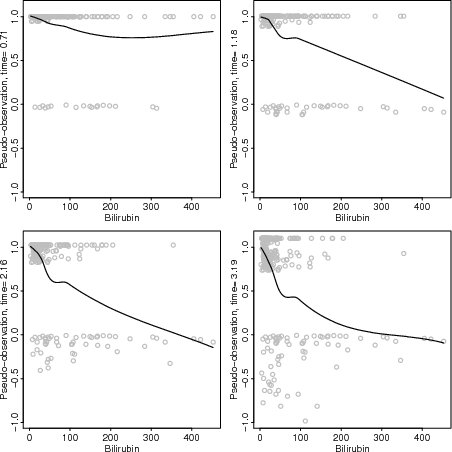 |
| Figure 4.1.18: R-source SAS-source (fig-pbc-ch4-pseudobiliscatter-cloglog) | 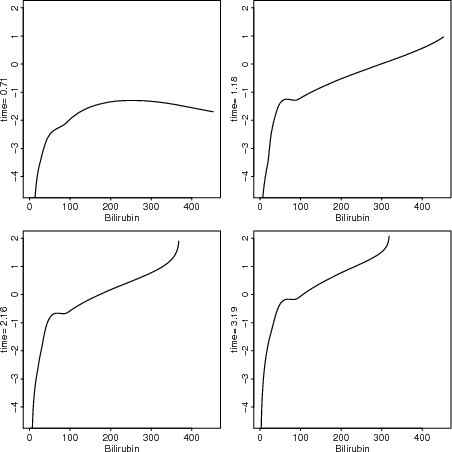 |
| Figure 4.1.19: R-source SAS-source (fig-pbc-ch4-pseudobilires) | 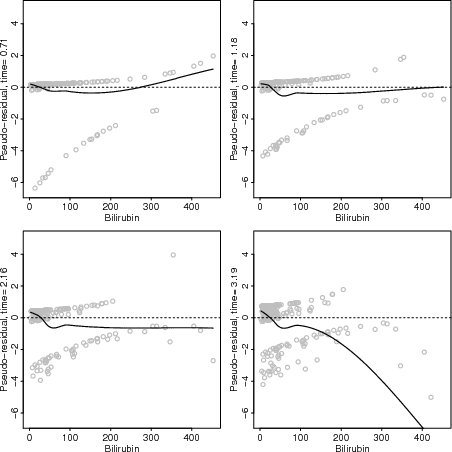 |
| Figure 4.1.20: R-source SAS-source (fig-ch4-bvslogbili) | 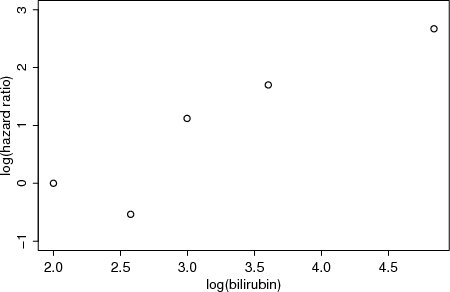 |
| Figure 4.1.21: R-source SAS-source (fig-pbc-ch4-pseudologbiliscatter) |  |
| Figure 4.1.22: R-source SAS-source (fig-pbc-ch4-pseudologbiliscatter-cloglog) |  |
| Figure 4.1.23: R-source SAS-source (fig-pbc-ch4-pseudologbilires) | 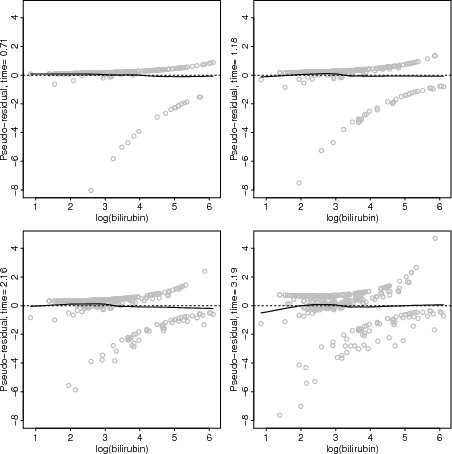 |
| Figure 4.1.24: R-source SAS-source (fig-ch4-logbilidiagnosticsvslogbili) |  |
| Figure 4.1.25: R-source SAS-source (fig-ch4-bilidiagnosticsvsbili) | 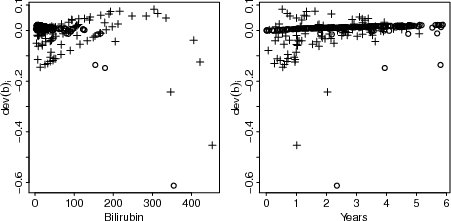 |
| Figure 4.2.2: R-source SAS-source Stata-source (fig-ch4pwchfig) |  |
| Figure 4.2.3: R-source SAS-source (fig-ch4-pwchpseudobiliscatter) |  |
| Figure 4.2.4: R-source SAS-source (fig-ch4-pwchpseudoLogbiliscatter) |  |
| Figure 4.2.5: R-source SAS-source (fig-ch4splinefig) |  |
| Figure 4.2.6: R-source SAS-source (fig-ch4-influential-bilisquared) |  |
| Table 4.2.1: R-source SAS-source (tab-ch4fractional) |  |
| Figure 4.2.7: R-source SAS-source (fig-ch4fractional) |  |
| Figure 4.2.8: R-source SAS-source (fig-ch4zeroexpfig) |  |
| Table 4.2.2: R-source SAS-source (tab-ch4zeroexptab) |  |
| Table 5.1.8: R-source SAS-source (tab-ch5-pbc-strat) |  |
| Table 5.1.10: R-source SAS-source (tab-ch5bilimeans) |  |
| Table 5.1.11: R-source SAS-source (tab-ch5treatment-bili) |  |
| Figure 5.1.9: R-source SAS-source (fig-ch5-fracnoint) |  |
| Figure 5.1.10: R-source SAS-source (fig-ch5-normrangenoint) |  |
| Figure 5.2.2: R-source SAS-source (fig-ch5-fracinteract) |  |
| Figure 5.2.3: R-source SAS-source (fig-ch5-normrangeinteract) |  |
| Figure 5.2.4: R-source SAS-source (fig-ch5-fractreat) |  |
| Figure 5.2.5: R-source SAS-source (fig-ch5-normrangetreat) |  |
| Table 5.2.12: R-source SAS-source (tab-ch5treatment-biliinteract) | 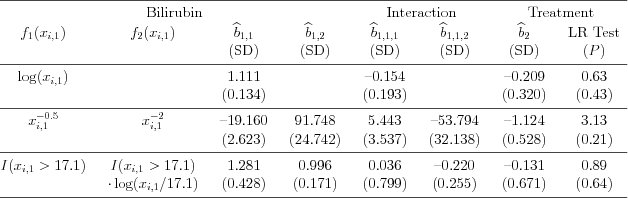 |
| Table 6.2.16: R-source SAS-source (tab-tmentstage) | 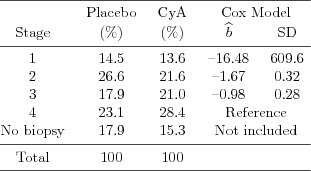 |
| Table 6.2.17: R-source SAS-source (tab-tmentother) | 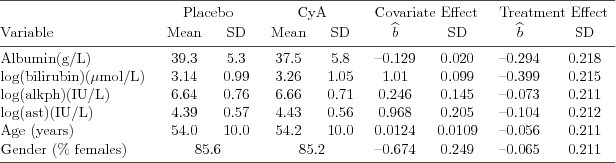 |
| Table 6.2.18: R-source SAS-source (tab-tmentresults) | 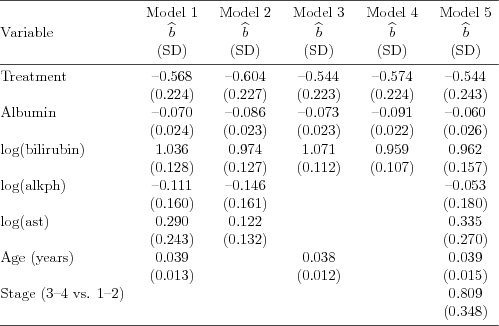 |
| Table 6.2.19: R-source SAS-source (tab-ch6pbc-prophaz) | 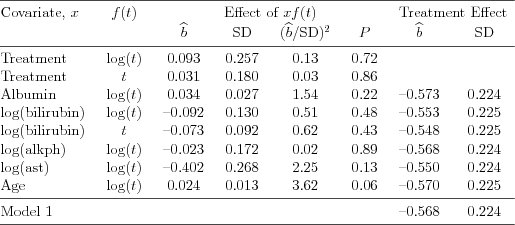 |
| Figure 6.2.14: R-source SAS-source (fig-ch6treat-baseline) | 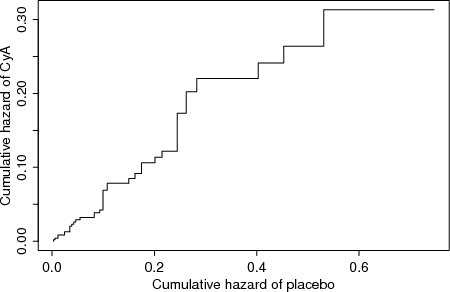 |
| Table 6.2.20: R-source SAS-source (tab-ch6-pbclinearity) |  |
| Figure 6.2.15: R-source SAS-source (fig-ch6pseudo-alb) | 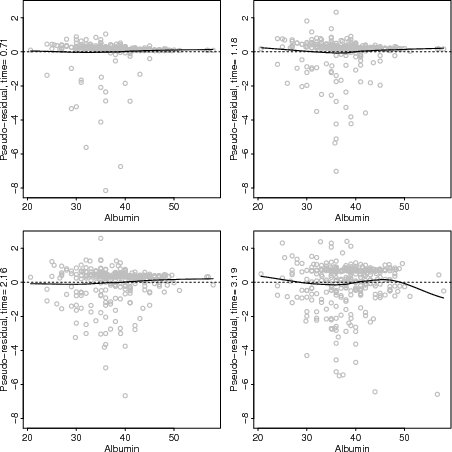 |
| Figure 6.2.16: R-source SAS-source (fig-ch6pseudo-logbili) | 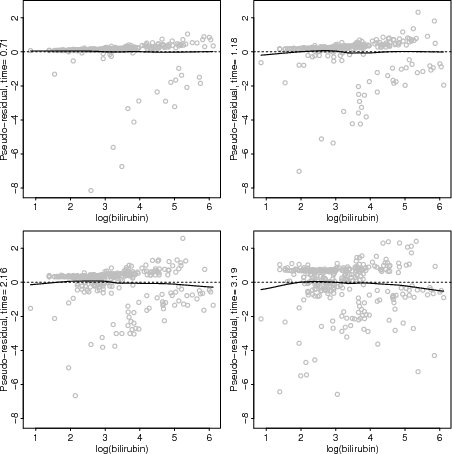 |
| Table 6.2.21: R-source SAS-source (tab-pbcfinal) |  |
| Figure 6.2.17: R-source SAS-source (fig-ch6pseudo-logalkph) |  |
| Figure 6.2.18: R-source SAS-source (fig-ch6pseudo-logamtr) | 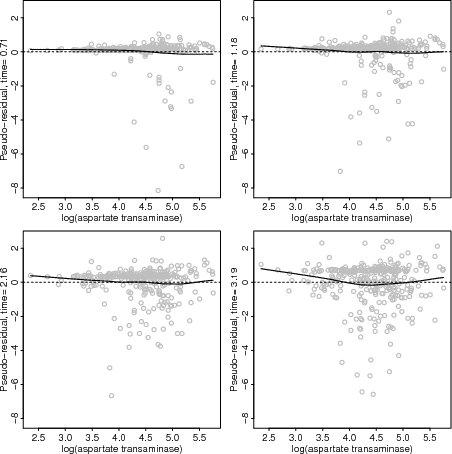 |
| Figure 6.2.19: R-source SAS-source (fig-ch6pseudo-age) | 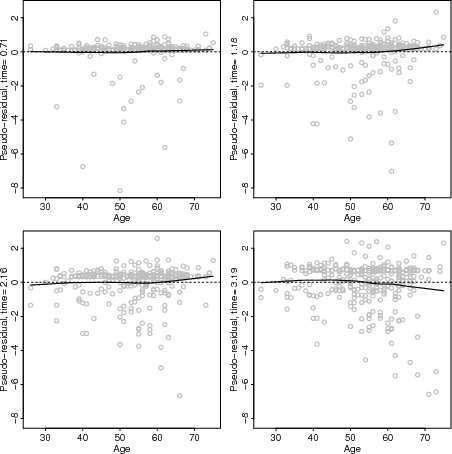 |
| Figure 6.2.20: R-source SAS-source (fig-albdiag) | 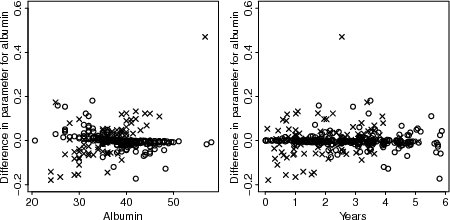 |
