Vitamin D
Example concerning body mass index and vitamin D status.

The data presented here come from a large study on vitamin D status in
four European countries, conducted by Rikke Andersen,
Fødevaredirektoratet, Denmark. The data provide age, body mass index
and vitamin D status for 420 women from 4 European countries.  Body
mass index (BMI) is a height corrected weight measure defined as
weight (in kilos) divided by height (in meters) squared.  Vitamin D
status is given via a measurement of 25-hydroxy-vitamin D (25OHD) in
serum and among the questions to be addressed using these data is
whether the 25OHD-level depends on BMI and on age.

Variable list:

age                    age of the individual

bmi                    body mass index

country                country of residence
                       1: Denmark
                       2: Finland
                       4: Ireland
                       6: Poland

category               1: girls
                       2: women

vitd		       the level of vitamin D, serum-25 hydroxi
		       S25OHD

sunexp		       sun exposure
		       1: avoid sun
		       2: sometimes
		       3: prefer sun

vitdintake	       Vitamin D intake
The dataset
Scripts for loading the dataset
Programs related to Vitamin D
| Table 1.1.1: R-source SAS-source Stata-source (tab-vitD-ch1intro-bmi) | 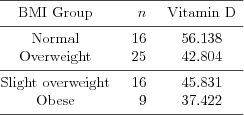 |
| Figure 1.2.1: R-source SAS-source Stata-source (fig-vitD-ch1covariates-ohdvs012) | 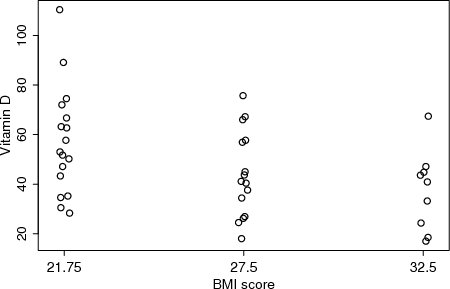 |
| Figure 1.2.2: R-source SAS-source Stata-source (fig-vitD-ch1covariates-ohdvsbmi) | 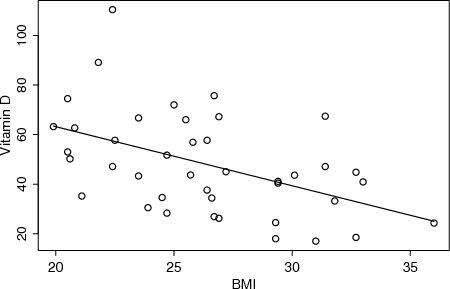 |
| Table 1.4.2: R-source SAS-source (tab-vitD-ch1multiple-fourobs) |  |
| Figure 1.4.1: R-source SAS-source (fig-vitD-ch1multiple-parallellines) | 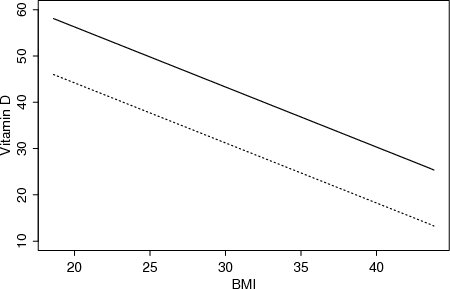 |
| Figure 2.2.2: R-source SAS-source (fig-ch2-vitd-histogram) | 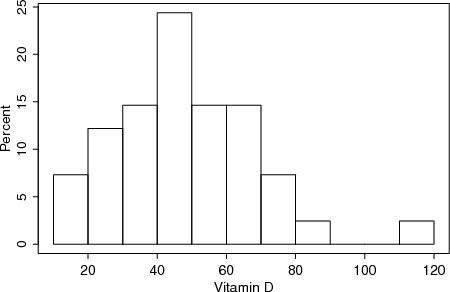 |
| Table 2.2.2: R-source SAS-source (tab-ch2-vitd-summary) | 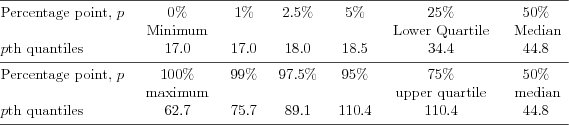 |
| Figure 2.3.5: R-source SAS-source Stata-source (fig-vitd-ch2-resdef) | 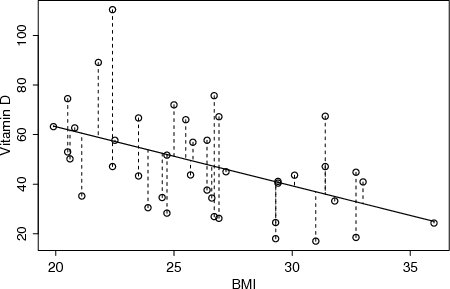 |
| Figure 2.3.6: R-source SAS-source (fig-ch2-vitd-resplots) | 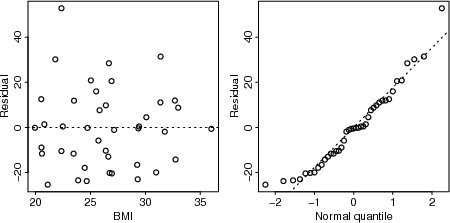 |
| Figure 2.3.8: R-source (fig-ch2-binom-score) |  |
| Figure 2.3.12: R-source (fig-ch2-all-tests) |  |
| Figure 3.1.1: R-source SAS-source (fig-vitD-ch3-2bmigroups) | 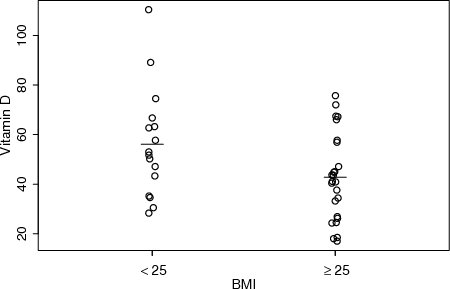 |
| Table 3.1.1: R-source SAS-source (tab-vitd-ch3-estimates) | 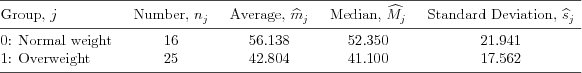 |
| Table 3.1.2: R-source SAS-source (tab-vitd-ch3-comparison) | 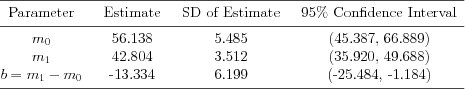 |
| Table 3.1.3: R-source SAS-source (tab-vitd-ch3-normal-t) | 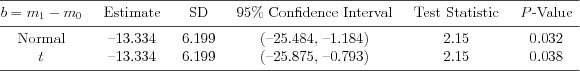 |
| Figure 3.1.2: R-source SAS-source (fig-vitD-ch3-resplots) |  |
| Table 3.1.4: R-source SAS-source (tab-vitd-ch3-sd) |  |
| Figure 3.1.3: R-source SAS-source (fig-lvitD-ch3-2bmigroups) | 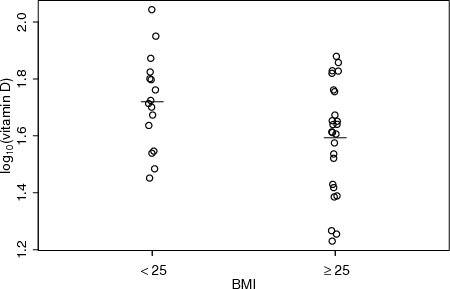 |
| Table 3.1.5: R-source SAS-source (tab-vitd-ch3-estimates-log) | 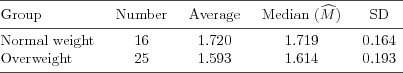 |
| Table 3.1.6: R-source SAS-source (tab-vitd-ch3-estimates-back) |  |
| Figure 3.1.4: R-source SAS-source (fig-lvitD-ch3-resplots-log) |  |
| Figure 3.2.5: R-source SAS-source (fig-vitD-ch3-3bmigroups) | 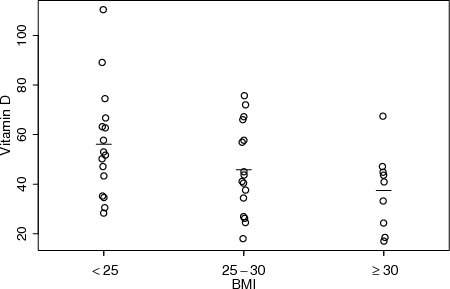 |
| Table 3.2.9: R-source SAS-source (tab-ch3-vitamind-multiple-log) |  |
| Figure 4.1.1: R-source SAS-source Stata-source (fig-vitd-ch4-pres) |  |
| Figure 4.1.2: R-source SAS-source Stata-source (fig-vitd-ch4-resdef) |  |
| Figure 4.1.3: R-source SAS-source Stata-source (fig-vitd-ch4-conf-pred) |  |
| Figure 4.1.4: R-source SAS-source Stata-source (fig-vitd-ch4-model-control) |  |
| Table 4.1.1: R-source SAS-source (tab-vitd-outliers) |  |
| Figure 4.1.5: R-source SAS-source (fig-vitd-ch4-outliers) |  |
| Figure 4.1.6: R-source SAS-source Stata-source (fig-vitd-ch4-diagnostics) |  |
| Table 5.1.2: R-source SAS-source (tab-vitD-ch5twocov-means) | 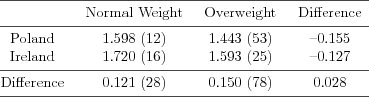 |
| Figure 5.1.1: R-source SAS-source (fig-ch5fourvitDmeans) | 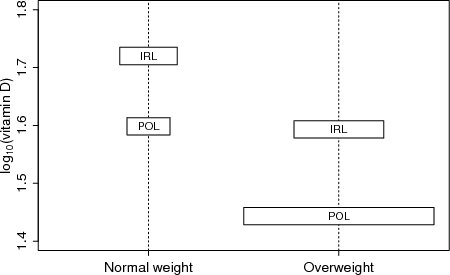 |
| Table 5.1.3: R-source SAS-source (tab-vitD-ch5twocov-fourexp-data) |  |
| Figure 5.1.2: R-source SAS-source (fig-ch5fourvitDresiduals) | 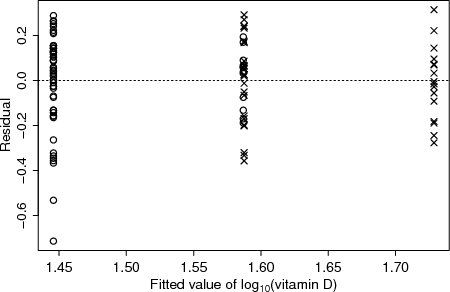 |
| Table 5.1.4: R-source SAS-source (tab-ch5fourvitDSDs) | 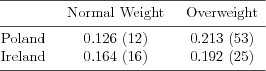 |
| Table 5.1.5: R-source SAS-source (tab-vitD-ch5-12-means) | 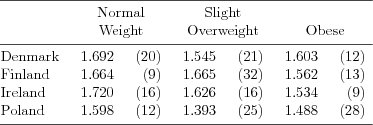 |
| Figure 5.1.3: R-source SAS-source (fig-vitD-ch5-vitDvsbmi) | 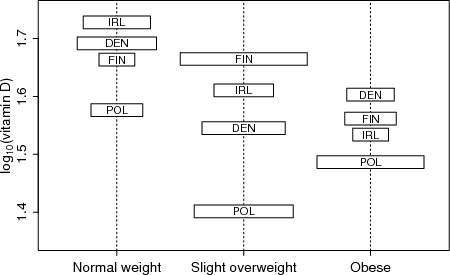 |
| Table 5.1.6: R-source SAS-source (tab-vitD-ch5-estimates) |  |
| Figure 5.1.4: R-source SAS-source (fig-ch5-vitD-twolinespar) |  |
| Figure 5.1.5: R-source SAS-source (fig-ch5-vitD-adjmeans) |  |
| Figure 5.1.6: R-source SAS-source (fig-ch5-vitD-twolines) | 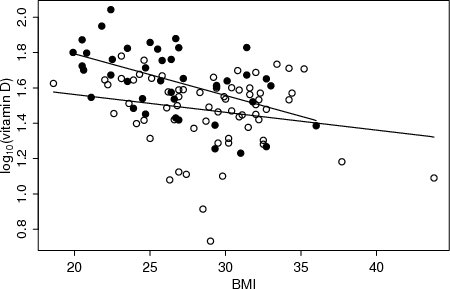 |
| Table 5.1.9: R-source SAS-source (tab-ch5linsplinetest) | 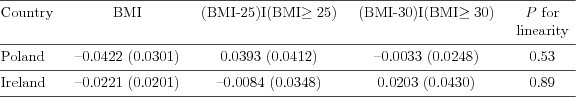 |
| Figure 5.1.7: R-source SAS-source (fig-ch5-vitD-twosplines) | 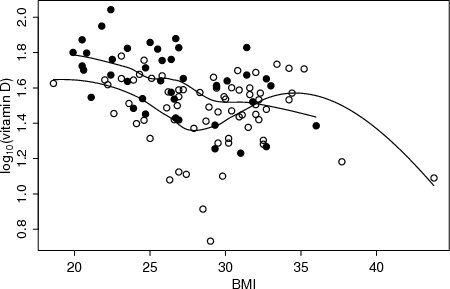 |
| Figure 5.1.8: R-source SAS-source (fig-ch5-vitD-resplot) |  |
| Table 5.2.1: R-source SAS-source (tab-vitD-ch5twocov-means-2) |  |
| Figure 5.2.1: R-source SAS-source (fig-ch5-vitd-country-int) |  |
| Table 5.2.11: R-source SAS-source (tab-ch5catquant-stratify) |  |
| Figure 5.3.1: R-source SAS-source (fig-ch5vitDbmivsage) |  |
| Table 6.2.1: R-source SAS-source (tab-ch6-vitd-country) | 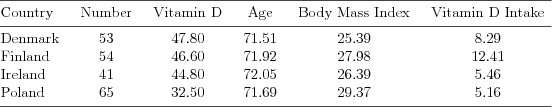 |
| Table 6.2.2: R-source SAS-source (tab-ch6-vitd-country-differences) |  |
| Table 6.2.3: R-source SAS-source (tab-ch6-vitd-sun) |  |
| Figure 6.2.2: R-source SAS-source (fig-ch6-vitd-quant) |  |
| Table 6.2.4: R-source SAS-source (tab-ch6-country-sun) | 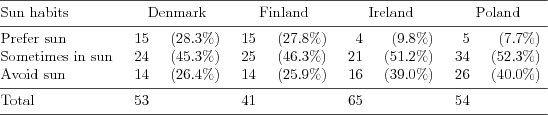 |
| Table 6.2.5: R-source SAS-source (tab-ch6-vitd-estimates-model1) | 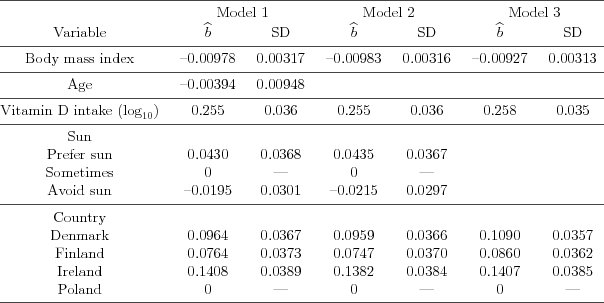 |
| Figure 6.2.3: R-source SAS-source (fig-ch6-vitd-model3-land) |  |
| Figure 6.2.4: R-source SAS-source (fig-ch6-vitd-vitdintake) |  |
| Table 6.2.6: R-source SAS-source (tab-ch6-vitd-interactions) |  |
| Figure 6.2.5: R-source SAS-source (fig-ch6-vitd-land-sun) |  |
| Figure 6.2.6: R-source SAS-source (fig-ch6-vitd-cook) | 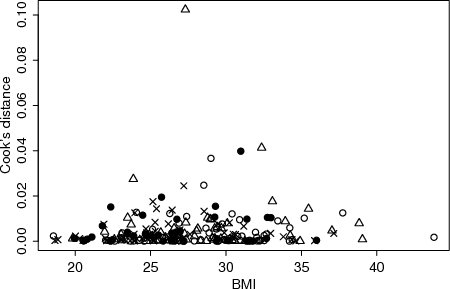 |
| Figure 6.2.7: R-source SAS-source (fig-ch6-vitd-influence) | 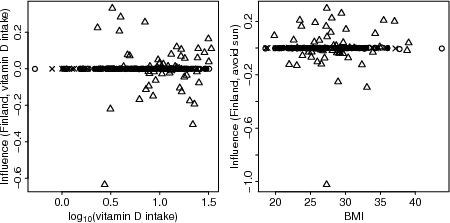 |
| Table 6.2.7: R-source SAS-source (tab-ch6-vitd-final) | 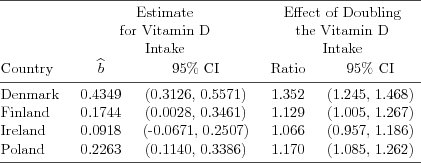 |
| Table 7.3.1: R-source SAS-source (tab-ch7-vitd-estimates) | 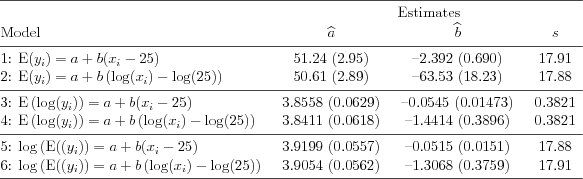 |
| Figure 7.3.1: R-source SAS-source (fig-ch7-quantitative-comparison6) | 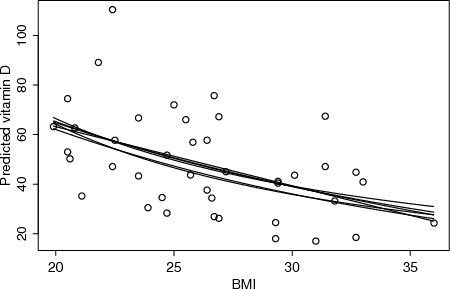 |
| Figure 7.3.2: R-source SAS-source (fig-ch7-quantitative-comparison2) |  |
